Exploring Reddit Community Relations with Graphs and Neo4j


Graphs are ubiquitous: from social networks, to molecular and traffic networks, their application domains are rather diverse. As exciting as these applications are, they can be quite complex and are perhaps not the best place to start if you want to learn about the applications of graphs and graph databases. The purpose of this post is to provide a stepping stone for those unfamiliar with these subjects. Our basis will be a conceptually simple graph based on open-source data collected from reddit, and we will analyze that data with the Neo4j DBMS.
First, we consider the contents of the dataset and how to transform it such that it can be imported into a graph database. Second, we spin up a dockerized instance of Neo4j and load the aforementioned graph into the graph database. Then, we use algorithms from Neo4j’s extensive libraries to analyze the data. Finally, some pointers for further graph exploration are provided.
A primer on graphs
While this post does not serve as a deep dive on the theoretical aspects of graphs, it is always a good idea to establish a common language on the subject we are working with. Before we get hands-on experience with graphs, let us consider its definition within a graph database context.
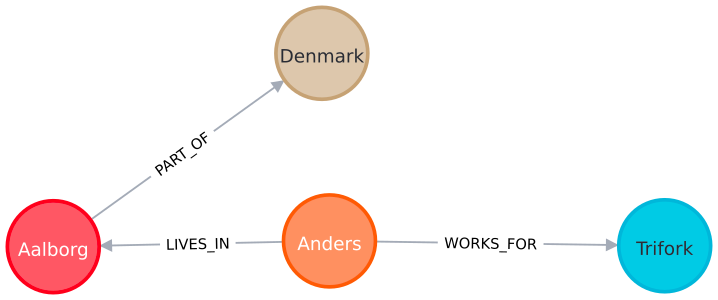
A graph is a data structure used to model pairwise relationships between objects. It is made up of nodes (a.k.a. vertices) that are connected by edges (a.k.a. links), thus forming relationships between them. In the graph database context, nodes typically represent domain entities (e.g., people, cities, companies). Relationships, on the other hand, express how those nodes are connected (e.g., “lives in”, “works for”). In a property graph model, as used by Neo4j, both nodes and relationships can furthermore have a number of properties (i.e., key-value pairs). For example, a node describing a person could have their name as a property, and a relationship describing a person’s work could have their start date and title at the company as properties.
In the example below, the relationships have a direction as indicated by the arrows. Generally, graphs are either directed or undirected. When using Neo4j specifically, a direction must always be specified on all relationships. When querying the graph later on, we can dismiss the direction.
A graph database stores these nodes, relationships, and properties, instead of storing tables or documents that you know of from traditional databases. Specifically, Neo4j stores these natively down to the storage level — not just as an abstraction over the graph. That makes handling relational data highly efficient compared to traditional relational databases, as there is no need to do expensive JOINs across tables. Furthermore, as we shall see later, it makes certain analytical queries like finding hidden connections between nodes a breeze.
Dataset
We will be using a dataset of 1.3M entries collected from reddit over a period of two months, from February 2022 to April 2022. Each entry in the dataset represents an interaction between two subreddits (communities dedicated to a specific topic). Interactions are either crossposts between two subreddits, analogous to e-mail forwards, or direct in-text mentions from one subreddit to another. Specifically, each entry contains the following:
- Timestamp of the interaction
- Authoring user
- Title of the post
- Referencing subreddit
- Referenced subreddit
- Type of interaction (crosspost or mention)
Data pre-processing
We could choose to import the 1.3M entries directly into Neo4j without any pre-processing of it. Specifically, each row contains the triple of information we need to form nodes and relationships, i.e., which pairs of nodes are connected and how they are connected. However, as there is a lot of noise in the dataset and a lot of repeated interactions, we first do the following:
- Normalize subreddit names
- Filter self-referential interactions
- Remove interactions made by top 2% users
- Remove single-interaction subreddit pairs
- Merge interactions between subreddit pairs
The purpose of step 3, where we remove the top 2% of users, serves to remove interactions made automatically, i.e., by bots. Looking at the distribution of posts, we can quite clearly see that it follows a long-tail distribution; that is, a small fraction of users is responsible for a large fraction of the posts.
As can be seen, just 2% of the most interacting users account for more than 50% of all interactions in the dataset — indeed, an extreme example of a long-tailed distribution. Looking at the most interacting users, they all appear to be automated accounts.
| User | Interactions |
|---|---|
| autotldr | 38288 |
| AutoModerator | 29421 |
| Faction_Chief | 26848 |
| sharewithme | 17961 |
| united-verdict-bot | 8049 |
Putting it together, the code for processing data is presented below. The Python package pandas is required, and the dataset itself is available on GitHub.
Generating nodes and relationships
Before importing the data into Neo4j, we need to write out the nodes and relationships as CSV files. For nodes, we write all distinct subreddits to a CSV file. We put the CSV files into a dataset folder, which we will later use when running Neo4j.
Writing out the relationships is also simple. As previously mentioned, the dataset already contains the triple of information needed to form a relationship. As such, we just need to write the processed data frame to a CSV file.
If you want to jump straight to data processing without assembling the parts provided here, the full processing script is available on GitHub.
Setting up Neo4j
We will be using a dockerized instance of Neo4j in this post. If you fancy a different experience, they also offer a desktop version as well as Aura, a managed cloud solution.
On line 5 container path /var/lib/neo4j/import is mounted to host path $PWD/dataset. The host path can be modified, as long as it contains the two files, subreddits.csvand relationships.csv, generated in the previous steps.
Line 6 specifies that plugins Awesome Procedures on Cypher (APOC) and Graph Data Science Library (GDS) should be included at runtime. You should not remove these, as they will be used throughout the remainder of the post. In brief, the APOC library provides a number of utility functions, while GDS provides 40+ graph algorithms.
Once the container is running, head to localhost:7474 in your browser and login with username and password neo4j. You will be prompted to change the password before you can use the database.
Importing data
With your local Neo4j instance running, we can begin importing data. We first import nodes, in this dataset consisting only of subreddits. Before importing, we create a constraint on the subreddit names to speed up the importing speed and avoid duplicates. In addition, by including USING PERIODIC COMMIT we instruct Neo4j to commit after every 1K nodes. We will be using the built-in LOAD CSV function to read the data, which is a good starting point for small to medium-sized datasets like our own.
Then we import relationships between the nodes, representing interactions between subreddits. On each relationship, we include some properties of one of the interactions to be inspected later.
The language we used to import is the Cypher query language, which we will use throughout the post to query our newly created graph. It is a Neo4j-specific language, and can be thought of as SQL for graphs, with the main addition of expressing graph patterns. One of the simplest Cypher queries we can do after importing is the “match everything” query.
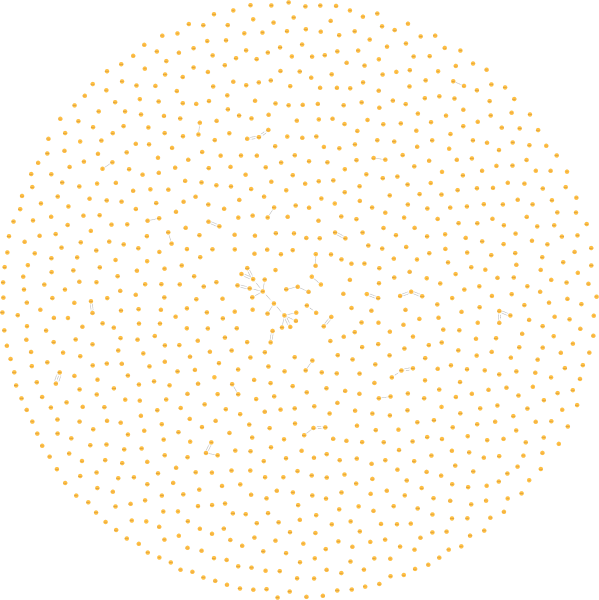
After running this query, you should get a visual excerpt of the graph similar to the one below. To spare your browser, Neo4j will provide a sub-graph with a limited number of nodes. You can interact with the nodes in your browser, and expand them to see all of a node’s connections as you see fit.
Analyzing the data
Time to analyze the newly imported graph. Let us start with posing some simple questions on the meta properties of the graph: what kind of nodes and relationships does it contain?
Querying meta properties
Neo4j provides a number of commands to help us understand the data better. To show what data is related and how, we can invoke the schema visualization function.
This shows that our graph is, indeed, quite simple. It only has one kind of node (Subreddit), and subreddits are related to each other either through mentions or crossposts. Since Neo4j, like many other NoSQL databases, is schemaless, this command is especially useful when familiarizing yourself with the structure of a new graph.

How many instances of nodes and relationships do we have? We can easily count both with the following queries.
This tells us that we have 35K nodes and 103K relationships. The relationship count is significantly lower than our original number of interactions in the dataset, since we removed the interactions of top users and merged interactions during data processing.
Finding a path between communities
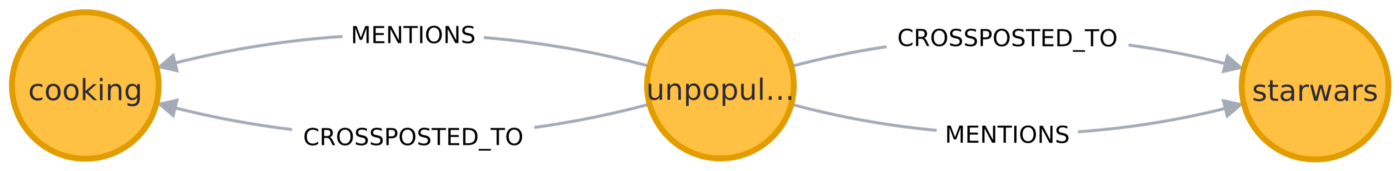
Given two seemingly unrelated communities, can we find a path between them? For example, can we find an undirected path between the seemingly unrelated cooking and starwars subreddits? We impose a constraint of 2 hops on the path to ensure relevancy of the result, and because Neo4j could otherwise find an infinite number of paths.
The resulting path shows us that the subreddit unpopularopinions references both the cooking and starwars subreddits — not surprising, as there are surely unpopular opinions in both communities. Since we included the title property on all relationships, you can hover over any of the relationships in your browser to see an example of what post contained a reference to the other subreddit.
Take a moment to consider how you would formulate such a query using SQL with a relational database. While it is doable, it would certainly not be pretty nor efficient to do so, especially when scaling to longer paths or with more heterogeneous data. An appealing aspect of graph databases is queries such as this one — easily finding relations in data that is not directly related.
Projecting the reddit graph
Before proceeding to the further graph analysis, we first create a projection of the graph and store it in Neo4j’s projection catalogue. A graph projection is a materialized view of the stored graph, containing only the analytically relevant data. The projections are stored in-memory, and exist as long as the Neo4j instance is running (or until manually deleted).
The projection above is quite verbose. We provide the explicit node label and both relationship types, but we could also have used a wildcard (*) in place of all of them. To get a more specific projection of the graph, we can even use Cypher. In our case, even though we are seemingly matching everything, some relationship properties are not projected: namely, we will not be needing thepostTitle, authoringUser, and timestamp properties during analysis, so there is no reason to spend resources on them.
Influential subreddits
If you frequent reddit, you may have an idea of what subreddits are influential— the ones that all redditors seem to know about. A naive way we could measure influence is to count the number of references made to a subreddit. However, that might provide a quite misleading picture: If two small subreddits are constantly referencing each other, but they are not mentioned anywhere else, do they really have a broad influence?
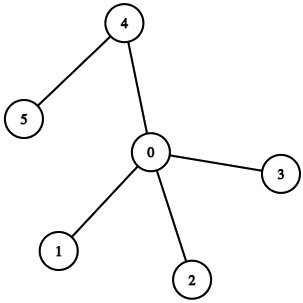
One way to measure this using graphs is by use of node centrality algorithms. These tell us not just that there are a lot of direct connections to a node, but also considers factors such as whether the node has transitive connections to other central nodes, and how easily it can reach other nodes in the graph. In the figure below, node 0 is an example of a central node. It provides the shortest path access to all other nodes, and if we were to remove it, there would no longer be a path from nodes 4 and 5 to the others.
A common algorithm for node centrality that you may already be familiar with is PageRank. Named after Google co-founder Larry Page, it is one of the fundamental algorithms used by Google for ranking search results. The algorithm considers not only the number of connections to a node when ranking it, but also the quality of them. A simple definition is best provided in the PageRank paper.
The output of PageRank is a probability distribution where, following the analogy above, we can think of each page’s score as a probability of a random surfer ending up on that page. PageRank, in addition to many other centrality algorithms, is part of Neo4j’s GDS library. We can choose to either stream the ranking with no side-effects, or write the score as a property to the stored graph — we will do the latter, so we can use the score for later analysis.
We specify that relationshipWeightProperty should be interactions. This results in a weighted variant of PageRank, where the random surfer will have a higher probability of following connections with a higher interaction count. This is optional, and you can experiment with the unweighted variant as well. Nevertheless, following the write we can find the highest-scoring subreddits.
This provides the following ranking of subreddits.
| name | pageRank |
|---|---|
| place | 467.1103171202828 |
| holup | 69.86856491210862 |
| ukraine | 54.08209424443552 |
| antiwork | 38.22382144807524 |
| publicfreakout | 38.004035569099536 |
The results here are quite interesting, but may not make a lot of sense to readers who are unfamiliar with reddit. For starters, place is a quinquennial April Fool’s event where all of reddit collaborate on a 2000x2000 pixels canvas (see it for yourself here). Due to its popularity it introduced rivalry and cooperation across more or less all communities, so it is not surprising to see it at the top. Another example is ukraine, which has received a lot of attention due to recent events. Interestingly, none of these subreddits are in top 31 by subscriber count as of April 2022, but seem to reflect better what is currently trending.
Providing recommendations
In addition to showing us the most central nodes in the graph, we can use PageRank to recommend us a new subreddit given a number of input subreddits. We can do this by specifying a user’s favourite subreddits as source nodes when running the PageRank algorithm. The source nodes refer to the nodes from which the surfer can restart after getting bored (as phrased in the PageRank explanation). Instead of allowing resets to all subreddits, they are limited to a user-specified subset. This variant of PageRank is called Personalised PageRank.
Returning to the culinary example from before, let us retrieve some recommendations from the cooking subreddit by using it as a source node. This time we will stream it, as we do not need the scores later.
In addition to including cooking as the only source node, we filter it away from the top results, as it would otherwise be a guaranteed top hit. The top 5 recommendations for cooking related subreddits are listed below.
| subreddit | score |
|---|---|
| askculinary | 0.0569441357431386 |
| baking | 0.03471128937847541 |
| kitchenconfidential | 0.027329515205689495 |
| onionlovers | 0.024366040810538565 |
| cookingforbeginners | 0.022945355868876718 |
Indeed, these results are all related to cooking. Of course, whether they would be deemed as good recommendations is a different matter.
Community detection
As mentioned previously, subreddits can be thought of as communities dedicated to a specific topic. In actuality, multiple subreddits typically cover similar topics to varying extents. For example, several subreddits cover the topic of Bitcoin, and more generally, finances and economics span a multitude of subreddits.
In the graph context, we think of communities as groups of nodes that are more densely connected than others. The Louvain method can be used to detect such communities by greedily optimizing a modularity metric. In brief, that metric measures how densely connected a group of nodes are, compared to how densely they would be connected in a random network. The Louvain method is also part of Neo4j’s GDS library, and the resulting communities can be written to the stored graph as we did with PageRank.
After community IDs are written to all nodes, we can find the biggest communities, as well as some representative subreddits for those using the PageRank score we stored previously.
When running this query, the following communities were returned from my database. Your results may differ as the Louvain method is non-deterministic.
| community | subreddit |
|---|---|
| 11413 | place, kgbtr, france, turkey, mexico |
| 24153 | ukraine, worldnews, downloadvideo, mapporn, china_irl |
| 5335 | antiwork, aboringdystopia, casualuk, me_irl, pics |
| 13506 | mademesmile, cats, aww, hydrohomies, contagiouslaughter |
| 20732 | cryptocurrency, nftsmarketplace, nft, opensea, algorand |
In the largest community we find the place subreddit mentioned before, and to see country specific subreddits among it is not surprising, as flags and nationalism made up a significant portion of the canvas. The other communities also make sense. For example, the cryptocurrency subreddit is grouped with NFT-related subreddits and a subreddit dedicated to a specific coin.
Cleaning up
Since this covers the analysis of our graph, we can free resources by dropping the graph projection like to (or if you wish to continue analysis after reading, feel free to keep it).
What’s next?
If you want to continue working with the reddit graph, you have several options. First, you could expand the complexity of the graph by including the authoring users in the graph schema. Second, you could build an API to generate subreddit recommendations based on the user’s input. Third, I recommend exploring Neo4j’s graph data science library further, as we have only scratched the surface in that regard.
If you are eager to explore other graphs, I would recommend taking a look at MindReader project, which includes a graph specifically made for Neo4j. The graph contains node types you would expect within the movie domain (movies, actors, genres), as well as explicit ratings on all these nodes from over 1K real users. As an exercise, use the MindReader graph in combination with Personalized PageRank to recommend yourself a movie for the night.
I chose not to cover the data collection process in this post. However, the script used for collecting the data is quite simple and available on GitHub. If you have any questions, comments, or corrections, feel free to send me an e-mail.